Meteorology: Part 1
Meteorology is the study of the weather and the atmosphere.
Fronts
Air is a dynamic substance. It has weight, mass, volume...in essence, it's made of atoms. When you have a large portion of air that has similar temperature and moisture content, it's called an air mass. There are 4 major air masses that affect the weather here in Virginia. Air masses can be hot or cold and moist or dry. Continental air is dry while marine air is moist. Tropical air is hot and polar air is cold. Combine these and you get 4 air masses:
cT - Continental tropical = warm, dry air
cP - Continental polar = cold, dry air
mT - Marine tropical = warm, moist air
mP - Marine polar = cold, moist air
When these air masses collide or interact, we get a front. Fronts cause the weather we experience. There are 4 different fronts with specific symbols that distinguish them on a weather map. The symbols on the line are on side in which the front is moving.
Cold Front: blue triangles; colder temperatures, strong storms, heavy rain, fast-moving
Warm Front: red semicircles; warmer temperatures, long-term gentle precipitation
Stationary Front: alternating blue triangles and red semicircles on either side of the line; weather stays the same for a while
Occluded Front: purple alternating triangles and semicircles on the same side of the line; severe storms, tornadoes, fast-moving
Pressure
Since air has mass, it has weight. It doesn't feel like it to us, but that's because our bodies are used to it. The weight of the air is called air pressure. We measure it in millibars (mb) in the SI system. Standard air pressure at sea level is 1 atm = 1013.24 mb = 14.696 psi (pounds per square inch). This pressure is all of the air above the surface of the Earth pressing down due to gravity. When we go into the mountains, there is less air over our heads, and thus the pressure is decreased. Our bodies adjust to this decrease in pressure by popping our eardrums to equalize the pressure in the ears. If we didn't, our eardrums would rupture...ouch!!! Pressure also affects the weather. High pressure systems tend to cause good weather and low pressure systems tend to cause bad weather. Think of a soda bottle. Shake it up and all the gas builds up in the bottle but can't escape; it looks calm. But open the bottle (lower the pressure) and all of the gas escapes violently. That's similar to the weather. High pressure keeps the water in. Low pressure lets the water out.
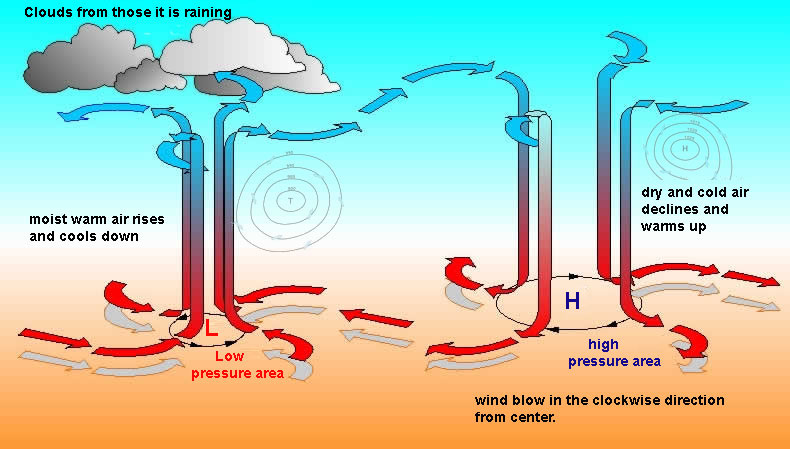
In a low pressure system, warm air gets sucked up into the sky. As the air rushes in, it rotates counter-clockwise. When it cools off, it falls back to the surface in a clockwise rotation pattern (high pressure). So, in short, air rises in a low pressure and falls in a high pressure; it's warm in a low pressure and cool in a high pressure; and it rotates counter-clockwise in a low pressure and clockwise in a high pressure. As air moves from high pressure to low pressure, it creates wind. The bigger the difference in pressure, the stronger the wind.
Fronts
Air is a dynamic substance. It has weight, mass, volume...in essence, it's made of atoms. When you have a large portion of air that has similar temperature and moisture content, it's called an air mass. There are 4 major air masses that affect the weather here in Virginia. Air masses can be hot or cold and moist or dry. Continental air is dry while marine air is moist. Tropical air is hot and polar air is cold. Combine these and you get 4 air masses:
cT - Continental tropical = warm, dry air
cP - Continental polar = cold, dry air
mT - Marine tropical = warm, moist air
mP - Marine polar = cold, moist air
When these air masses collide or interact, we get a front. Fronts cause the weather we experience. There are 4 different fronts with specific symbols that distinguish them on a weather map. The symbols on the line are on side in which the front is moving.
Cold Front: blue triangles; colder temperatures, strong storms, heavy rain, fast-moving
Warm Front: red semicircles; warmer temperatures, long-term gentle precipitation
Stationary Front: alternating blue triangles and red semicircles on either side of the line; weather stays the same for a while
Occluded Front: purple alternating triangles and semicircles on the same side of the line; severe storms, tornadoes, fast-moving
Pressure
Since air has mass, it has weight. It doesn't feel like it to us, but that's because our bodies are used to it. The weight of the air is called air pressure. We measure it in millibars (mb) in the SI system. Standard air pressure at sea level is 1 atm = 1013.24 mb = 14.696 psi (pounds per square inch). This pressure is all of the air above the surface of the Earth pressing down due to gravity. When we go into the mountains, there is less air over our heads, and thus the pressure is decreased. Our bodies adjust to this decrease in pressure by popping our eardrums to equalize the pressure in the ears. If we didn't, our eardrums would rupture...ouch!!! Pressure also affects the weather. High pressure systems tend to cause good weather and low pressure systems tend to cause bad weather. Think of a soda bottle. Shake it up and all the gas builds up in the bottle but can't escape; it looks calm. But open the bottle (lower the pressure) and all of the gas escapes violently. That's similar to the weather. High pressure keeps the water in. Low pressure lets the water out.
In a low pressure system, warm air gets sucked up into the sky. As the air rushes in, it rotates counter-clockwise. When it cools off, it falls back to the surface in a clockwise rotation pattern (high pressure). So, in short, air rises in a low pressure and falls in a high pressure; it's warm in a low pressure and cool in a high pressure; and it rotates counter-clockwise in a low pressure and clockwise in a high pressure. As air moves from high pressure to low pressure, it creates wind. The bigger the difference in pressure, the stronger the wind.
Weather Maps
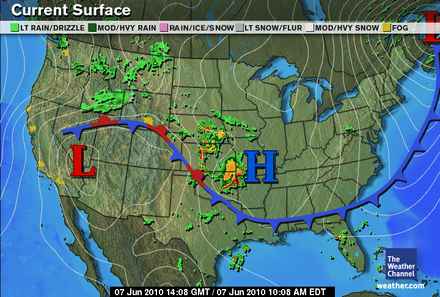
We use pressure and fronts to model what weather will happen in the future. This is called forecasting. It's not completely exact, but you can't predict the future. Pressure is shown on maps using a red L for low pressure and a blue H for high pressure. It's also depicted using circular lines similar to contour lines. These are called isobars (this means "equal weight" since pressure is really the weight of the air). Add front symbols and Doppler radar (for precipitation) to the isobars and highs and lows and you get a weather map.
We use pressure and fronts to model what weather will happen in the future. This is called forecasting. It's not completely exact, but you can't predict the future. Pressure is shown on maps using a red L for low pressure and a blue H for high pressure. It's also depicted using circular lines similar to contour lines. These are called isobars (this means "equal weight" since pressure is really the weight of the air). Add front symbols and Doppler radar (for precipitation) to the isobars and highs and lows and you get a weather map.
Weather Station Models
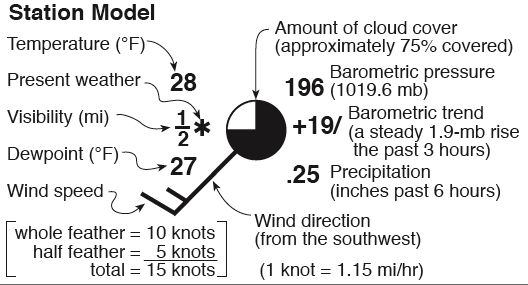
Station models show all of the important weather information for a single location in a single diagram. Click on the diagram at right to see a larger image of what can be shown on a station model. The dew point is the temperature at which the air cannot hold any more water and it condenses (comes out of the air). Imagine a balloon with a little bit of water in it. If you put air into the balloon, it looks like the water level goes down. But, as the air leaves the balloon, the water rises and will eventually come out when there is no more room for it inside. That relates to humidity, which is the percentage of water in the air. The higher the dew point, the higher the humidity.
Station models show all of the important weather information for a single location in a single diagram. Click on the diagram at right to see a larger image of what can be shown on a station model. The dew point is the temperature at which the air cannot hold any more water and it condenses (comes out of the air). Imagine a balloon with a little bit of water in it. If you put air into the balloon, it looks like the water level goes down. But, as the air leaves the balloon, the water rises and will eventually come out when there is no more room for it inside. That relates to humidity, which is the percentage of water in the air. The higher the dew point, the higher the humidity.
